


 Your new post is loading...


While not everyone can make infographics from scratch, there are tools available on the Web that will help you create your very own infographics. In this article, we’re listing more than 20 such options to help you get your messages across to your readers, visually.
What About Me?
"What About Me?" is a personalization tool that produces colorful infographics that display your social media habits automatically from Facebook, Twitter and YouTube. The tool is provided by Intel. Create an infographic of your digital life and become inspired by the people you know, the things you see, and the experiences you have online.
Vizualize.me
Vizualize.me allows you to create an online resume format that is beautiful, relevant and fun, all with just one click. It enables you to express your professional accomplishments in a simple yet compelling personal visualization, and will help optimize your LinkedIn Profile to get a kickass Visual Resume.
Piktochart
With Piktochart, you get to create an innovative Infographic using a combination of different types of visualizations: themes, icons, vectors, images and chart exporter. Drag-and-drop and click your way through color schemes, shapes and fonts, then export the materials as static or html to easily embed it for use at your site.
easel.ly
Easel.ly is a fun tool to create your Infographics with drag and drop features and a simple interface. You can easily create and share visual ideas online, supported by ‘vhemes’ or visual themes that help you get started from the preset Infograpic style. Drag and drop a ‘vheme’ onto your canvas to turn your idea into a full infographic.
Visual.ly (http://goo.gl/issJu)
Visually helps you customize infographics in seconds, and no, you don’t have to be an analyst or designer to make infographics with Visually Create. Visual.ly allows you to also discover infographics and favorites from other users.
Infogr.am (http://goo.gl/UaK3G)
Infogr.am is a simple yet most exciting way to create static and interactive infographics. Import raw data to Infogr.am, and the site’s online tool will help you turn that data into a nice looking chart or full-blown infographic in minutes.
Many Eyes (http://goo.gl/9SKr5)
Many Eyes is an experiment by IBM Research and the IBM Cognos software group with a simple belief: ‘Finding the right way to view your data is as much an art as a science’. Many Eyes provides a range of visualizations from the ordinary to the experimental, where each can be put together with a click.
Venngage (http://goo.gl/GhLG7)
Venngage is an online infographics tool that helps you create and publish custom infographics, and at the same time, engage viewers and track results. Venngage allows you to create beautiful infographics for blogs and websites and you can also watch the numbers of your audience grow with compelling and beautiful content.
iCharts (http://goo.gl/PXFFx)
With iCharts, you can create great-looking charts in minutes with interactive and easy-to-share data. iCharts makes it easy to visualize, share and distribute big and small data.
Dipity (http://goo.gl/V4QLU)
Dipity is a free digital timeline website, if you are looking for a different type of Infographics. The mission is to organize the web’s content by date and time. Dipity is the fastest and easiest way to bring history to life with stunning multimedia timelines.
Timeline JS (http://goo.gl/gCqpr)
TimelineJS is a beautifully crafted timeline that is easy and intuitive to use. You can pull in media from different sources with built-in support for Twitter, Flickr, Google Maps, YouTube, Vimeo, Dailymotion, Wikipedia, SoundCloud and more.
StatSilk (http://goo.gl/Hk2DE)
StatSilk offers web-based and desktop software to make data analysis easy, efficient and enjoyable, to cater to diverse mapping and visualisation needs.
InFoto Free (http://goo.gl/6uM6r)
InFoto Free is an app for your Android to create an infographic of your photo-taking habits, using a Photo stats analyzer. With InFoto Free you can create awesome looking high-res infographics from your photo collection. It tells you things like what time of the day you prefer to take photos in, whether you prefer horizontal or vertical orientations as well as your favorite city to shoot in.
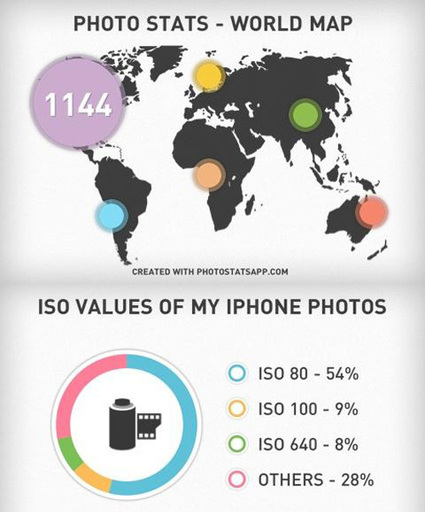
Photo Stats (http://goo.gl/b8mB1)
Photo Stats is an iPhone app that analyses the photos you take on your iPhone. The app generates cool and stylish infographics that shows how, when and where you take your photos from. You get to easily visualize your photo-taking habits and share it with friends.
More Tools
ChartsBin (http://goo.gl/kSZ2k) – An online tool to create your own interactive map instantly with no installation or coding needed, and you can embed the map in your own website or blog easily too.
Tableau Public (http://goo.gl/EkmM0) – A free application for your Windows computer that brings data to life. You can create and share interactive charts and graphs, stunning maps, live dashboards and fun applications in minutes. Anyone can do it, it’s that easy.
Creately (http://goo.gl/D3gx8) – Want to create beautiful diagrams in no time? Creately may be a good choice to use as it can be used across all sectors by individuals, corporate teams, developers, software architects, students and teachers alike for diagramming purposes.
Gliffy (http://goo.gl/x3O6n) – Gliffy helps to easily create professional-quality flowcharts, diagrams, floor plans, technical drawings, and more. You can easily drag-and-drop your way through the makings of an infographic using the many shapes from an extensive library.
SIMILE Widgets (http://goo.gl/TvzqR) – SIMILE is a free and open-source data visualization Web widget.
Tagxedo (http://goo.gl/2l0Uf) – Tagxedo turns words – famous speeches, news articles, slogans, themes, even your love letters – into a visually stunning word cloud. Every word is individually sized to highlight the frequencies of occurrence within the body of text.
Wordle (http://goo.gl/XS56D) – Wordle is a simple web app for generating “word clouds” from the text you provide. While the clouds give greater prominence to words that appear more frequently in the source text, you can also tweak your clouds with different fonts, layouts, and color schemes.
Via 173 Sud, Chrisange , Rose Marie DeSousa, massimo facchinetti, Becky Gaylord, John van den Brink


While not everyone can make infographics from scratch, there are tools available on the Web that will help you create your very own infographics. In this article, they-re listing more than 20 such options to help you get your messages across to your readers, visually.
Some of them really simple. Most of them... visual. Try, gooo