


Via Robin Good
Research and publish the best content.
Get Started for FREE
Sign up with Facebook Sign up with X
I don't have a Facebook or a X account
Already have an account: Login

Latest Social Media News
112.8K views |
+0 today
 Your new post is loading...
 Your new post is loading...
Your new post is loading...


TeresaSiluar's curator insight,
April 27, 2014 11:28 AM
Uso de mapas mentales en la curación de contenidos.
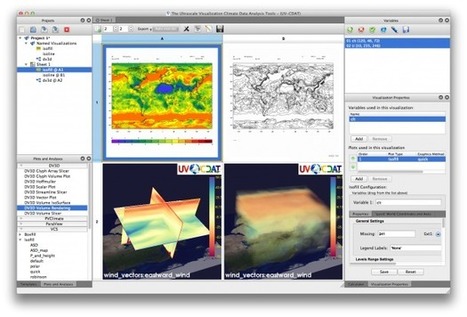
Data is everywhere and well-designed data graphics can be both beautiful and meaningful. As visualizations take center stage in a data-centric world, researchers and developers spend much time understanding and creating better visualizations. But they spend just as much time understanding how tools can help programmers and designers create visualizations faster, more effectively, and more enjoyably.
As any visualization practitioner will tell you, turning a dataset from raw stuff in a file to a final result in a picture is far from a single-track, linear path. Rather, there is a constant iteration of competing designs, tweaking and evaluating at once their pros and cons. The visualization research community has recognized the importance of keeping track of this process.
Read the complete article to learn more about the future of the practice and the tools that enable designers to create thoughtful infographics and visualizations... Via Lauren Moss, Antonios Bouris
|

From
mashable

Ever wonder what it would look like to plot every single geotagged tweet since 2009 on a map? Twitter has done just that.
Twitter posted these maps of Europe, New York City, Tokyo and Istanbul on its blog Friday. They use billions of geotagged tweets: Every dot represents a tweet, with the brighter colors showing a higher concentration of tweets. It's pretty amazing how the mapped-out tweets clearly match with population centers, highways and the like — though perhaps that's obvious. Via Lauren Moss, Neil Ferree

Miles Gibson's curator insight,
October 5, 2014 9:41 PM
Unit 1 Nature and Perspectives of Geography. This is a map of all of the geotagged twitter posts from 2009 to now in the United States. Its shows population distribution and points of interest that people like to travel to. It shows dense population centers and highways. You can see the roads in the map because of space in the map not covered. The brighter colors are in higher population and more popular travel destinations. This is a map of many types. This map is a part of unit 1 because it is a map of a basic geographic concept. This map is a functional map of sorts because it shows points of travel that people go to, but it is not varied by distance so it is not a precise version. This map is a definite example of a thematic map because it shows the story of the travel destinations of five years of their lives.
What does it mean for online content to "go viral"? An analysis of almost a billion information cascades on Twitter news, videos, and photos has produced the... Via Robin Good

Robin Good's curator insight,
March 16, 2013 3:12 PM
ViralSearch from Microsoft Research Labs is a new means to navigating, searching, content that spreads over social media. From the official site: "An analysis of almost a billion information cascades on Twitter news, videos, and photos has produced the first quantitative notion of whether something has indeed gone viral, thereby enabling further research into topic experts, trending topics, and viral-incident metrics." A fantastic tool, but still in its testing phase. Hope it will soon be available to many. Original video: http://youtu.be/wSwOszoHuoI Download video: http://msrvideo.vo.msecnd.net/rmcvideos/185452/dl/185452.mp4
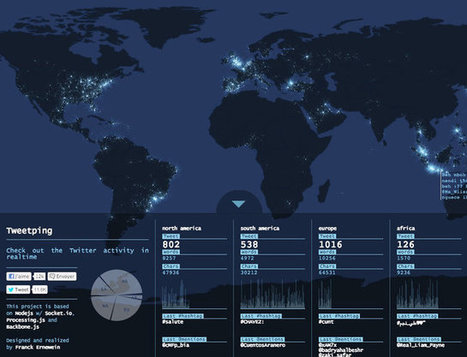
By Franck Ernewein, Tweetping is a map that shows where everyone in the whole world is tweeting from in real time.
Much like Poptip’s treatment of Twitter, you’re not really meant to follow it all. Country-by-country tickers do track the total tweets, words, and characters sent since you signed on, but hashtags and @-mentions flash for milliseconds, constantly replaced by a stream of data that can’t be paused for a moment, lest the system fall perpetually behind. Meanwhile, the geolocations of each tweet make their way to a world map as a glowing dot. As the tweets pile up, so do the dots, meaning the world transforms from prehistoric shadows to blindingly bright connectivity in a matter of minutes. Via Lauren Moss, Jack Patterson
|


Silk is a web tool to publish online spreadsheet-based data on a specific topic.
The service, which just released a new version of its offering, allows to easily convert any existing data-set into professional-looking data displays, charts, grids, and lists that can be embedded on any site and which can be viewed in multiple ways.
The value of Silk is specifically in making it easy and immediate for anyone to elegantly display and publish data sets in one of several alternative formats which include:
How it works: Import a table from Excel, Google Sheets or any .csv file, select the fields you want to import and Silk does the rest offering you tools to filter, edit and select your preferred visualization approach.
You can also create data sets and displays from scratch inside Silk, and set each Silk either as public or private.
Why it is relevant for content curators: Silk provides a unique and powerful opportunity to leverage existing data and information assets, spreadsheets and databases and to convert them into highly legible and visually impactful data displays on a very specific topic.
My evaluation: Paired with the power of Kimonolabs or Import.io to convert any website or page content into a spreadsheet, it offers great potential in creating value by providing multiple professional formats to display, present and interact with such data.
Great tool for curating data-based information assets.
Free forever for public Silks of up to 3000 pages.
Try it out now: https://www.silk.co/
Video tutorials: https://www.silk.co/product
Silk is a web tool to publish online spreadsheet-based data on a specific topic.
The service, which just released a new version of its offering, allows to easily convert any existing data-set into professional-looking data displays, charts, grids, and lists that can be embedded on any site and which can be viewed in multiple ways.
The value of Silk is specifically in making it easy and immediate for anyone to elegantly display and publish data sets in one of several alternative formats which include:
Table ListGrid MosaicGroupsBarsMapDonutLinePieScatterStacksHow it works: Import a table from Excel, Google Sheets or any .csv file, select the fields you want to import and Silk does the rest offering you tools to filter, edit and select your preferred visualization approach.
You can also create data sets and displays from scratch inside Silk, and set each Silk either as public or private.
Why it is relevant for content curators: Silk provides a unique and powerful opportunity to leverage existing data and information assets, spreadsheets and databases and to convert them into highly legible and visually impactful data displays on a very specific topic.
My evaluation: Paired with the power of Kimonolabs or Import.io to convert any website or page content into a spreadsheet, it offers great potential in creating value by providing multiple professional formats to display, present and interact with such data.
Great tool for curating data-based information assets.
Free forever for public Silks of up to 3000 pages.
Try it out now: https://www.silk.co/ ;
Video tutorials: https://www.silk.co/product ;