


Research and publish the best content.
Get Started for FREE
Sign up with Facebook Sign up with X
I don't have a Facebook or a X account
Already have an account: Login

Latest Social Media News
112.8K views |
+0 today
 Your new post is loading...
 Your new post is loading...
Your new post is loading...
![Infographics ROCK Twitter and LinkedIn, Leave Facebook Cold: Measuring ROI [Infographic] | Latest Social Media News | Scoop.it](https://img.scoop.it/8ONIJFh_uLfxrIaXTBQTzzl72eJkfbmt4t8yenImKBVvK0kTmF0xjctABnaLJIm9)
Infographics on Return On Infographics ROI on business for sales and conversion of product with search engine ranking, social interaction, page views Via Martin (Marty) Smith 

Lynn O'Connell for O'Connell Meier's curator insight,
February 8, 2013 4:05 PM
Facebook doesn't show enough of a infographic to allow it to have impact. To share there, make a photo of the top and link to another site. 
Ken Morrison's curator insight,
February 18, 2013 6:22 PM
Ken's Key Takeaway: I am sharing this link for two reasons. I like that it shares a list of the most popular infographic. I also like that it shows how to attempt to evaluate the ROI of an infographic. 
255's comment,
February 20, 2013 12:21 AM
Could be that infographics tells something in an easy way about relevant point ?
Robin Good: Extracting meaning out of big data, illustrating and visualizing relationships and links between apparently disconnected items and approaching the gathering of information for the purpose of surfacing what otherwise would not be immediately evident, may all be commercially fertile areas as some of the pionerring examples seem to show.
From the original essay, part of the Data Journalism Handbook: "Many journalists seem to be unaware of the size of the revenue that is already generated through data collection, data analytics and visualization.
This is the business of information refinement.
With data tools and technologies it is increasingly possible to shed a light on highly complex issues, be this international finance, debt, demography, education and so on.
...These technologies can now be applied to journalism...
But how does this generate money for journalism?
The big, worldwide market that is currently opening up is all about transformation of publicly available data into something our that we can process: making data visible and making it human.
We want to be able to relate to the big numbers we hear every day in the news — what the millions and billions mean for each of us.
There are a number of very profitable data-driven media companies, who have simply applied this principle earlier than others. They enjoy healthy growth rates and sometimes impressive profits.
a) One example: Bloomberg. The company operates about 300,000 terminals and delivers financial data to it’s users. If you are in the money business this is a power tool. ... This core business generates an estimated US $6.3 billion per year, at least this what a piece by the New York Times estimated in 2008. As a result, Bloomberg has been hiring journalists left, right and centre, they bought the venerable but loss-making “Business Week” and so on.
b) Another example is the Canadian media conglomerate today known as Thomson Reuters. They started with one newspaper, bought up a number of well known titles in the UK, and then decided two decades ago to leave the newspaper business. Instead they have grown based on information services, aiming to provide a deeper perspective for clients in a number of industries. If you worry about how to make money with specialized information, the advice would be to just read about the company’s history in Wikipedia. c) And look at the Economist. The magazine has built an excellent, influential brand on its media side. At the same time the “Economist Intelligence Unit” is now more like a consultancy, reporting about relevant trends and forecasts for almost any country in the world. They are employing hundreds of journalists and claim to serve about 1.5 million customers worldwide."
If you are still doubtful that big data, information refinement, news curation and specialized info services are areas where it is going to be tough to create revenues, think again.
Recommended. 9/10
Full essay: http://datajournalismhandbook.org/1.0/en/in_the_newsroom_10.html
Via Robin Good
|

Data is everywhere and well-designed data graphics can be both beautiful and meaningful. As visualizations take center stage in a data-centric world, researchers and developers spend much time understanding and creating better visualizations. But they spend just as much time understanding how tools can help programmers and designers create visualizations faster, more effectively, and more enjoyably.
As any visualization practitioner will tell you, turning a dataset from raw stuff in a file to a final result in a picture is far from a single-track, linear path. Rather, there is a constant iteration of competing designs, tweaking and evaluating at once their pros and cons. The visualization research community has recognized the importance of keeping track of this process.
Read the complete article to learn more about the future of the practice and the tools that enable designers to create thoughtful infographics and visualizations... Via Lauren Moss, Antonios Bouris

Robin Good: David McCandlees, the author of the book Information is Beautiful celebrates great data visualization and information design work through the Information is Beautiful Awards.
» Data visualization– A singular visualisation of data or information.» Infographic – Using multiple data visualisations in service to a theme or story
» Interactive visualization – Any viz where you can dynamically filter or explore the data.
» Data journalism – A combination of text and visualizations in a journalistic format.
» Motion infographic – Moving and animated visualizations along a theme or story.
» Tool or website – Online tools & apps to aid datavizzing.
The selection itself is worth a tour of the site and of this initiative.
Check: http://www.informationisbeautifulawards.com/
Longlist selection: http://www.informationisbeautifulawards.com/2012/07/our-longlist/
Shortlist selection: http://www.informationisbeautifulawards.com/2012/08/awardshortlist/
Via Robin Good
|


This is another post where I recommend that you scroll down to have a look at Robin Good's great commentary. I can not beat his for details. His Scoop.it site is: http://curation.masternewmedia.org/ Thanks Robin!
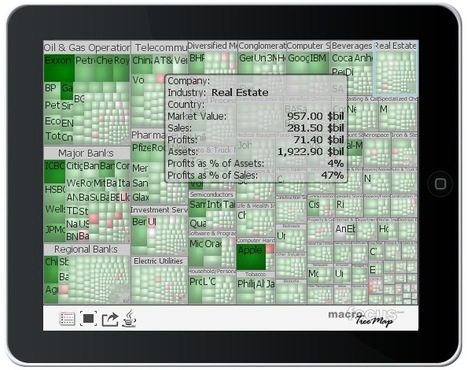
If you are looking for additional visualization tools for displaying data, TreeMap v. 3.0 offers a classic tree map layout as well as others, like squarified variant, circular, tag cloud and voronoi.
Interesting tool, give it a try