


Via Robin Good
Research and publish the best content.
Get Started for FREE
Sign up with Facebook Sign up with X
I don't have a Facebook or a X account
Already have an account: Login

Latest Social Media News
112.8K views |
+0 today
 Your new post is loading...
 Your new post is loading...
Your new post is loading...
Data Curation as Digital Preservation of Documents and Electronic Artifacts: Key Reference Resources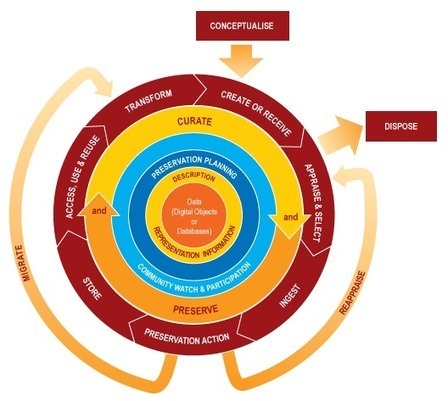
Robin Good: Data (or Digital) Curation, is an academic/scientific discipline dedicated to preserve, organize and collect digital documents and other electronic artifacts for archival, re-use and repurposing objectives.
Check: http://en.wikipedia.org/wiki/Data_curation and http://en.wikipedia.org/wiki/Digital_curation
The importance of Data Curation can be easily underestimated as it may appear, to the casual viewer, as an arid, tedious document archival job.
In reality, Digital Curation efforts are of great value to the preservation of important cultural documents and data for future researchers who will want to access, in some organized way, the data-information-artifacts of our time. In addition, the data curation practices and guidelines developed by academic and research institutions can also be of value and inspiration to other types of curation work, that may adopt, emulate or innovate upon them. University of Arizona – Digital Information Management University of Illinois – Data Curation Education Program University of North Carolina – DigCCurr University of Virginia – Scientific Data Consulting Digital Curation Centre Digital Curation Exchange International Journal of Digital Curation Purdue-UIUC Data Curation Profiles Project
Useful. 7/10
Via Robin Good 

Ali Angulo's curator insight,
August 26, 2017 5:51 PM
Curaduría de datos y preservación de documentos digitales

Robin Good: A valuable resource for anyone interested in the creation, organization and preservation of digital collections for the humanities, is this curated selection of resources and citations made available by the DH Curation Guide.
"The DH Curation Guide is a compilation of articles that address aspects of data curation in the digital humanities.
The goal of the DH Curation Guide is to direct readers to trusted resources with enough context from expert editors and the other members of the research community to indicate to how these resources might help them with their own data curation challenges."
DH Curation Guide: http://guide.dhcuration.org/index.html
Of particular interest in this collection:
The concept of collection from the user’s perspective by H. L. Lee.
A framework for contextual information in digital collections by Lee, C. A.
Thematic Research Collections by Palmer, C. L.
A framework of guidance for building good digital collections by NISO Framework Advisory Group
Full guide: http://guide.dhcuration.org/collections/ Via Robin Good
|

ghbrett's curator insight,
July 18, 2013 9:08 AM
This is another post where I recommend that you scroll down to have a look at Robin Good's great commentary. I can not beat his for details. His Scoop.it site is: http://curation.masternewmedia.org/ Thanks Robin! 
Jenifer Rettler's curator insight,
July 18, 2013 10:15 AM
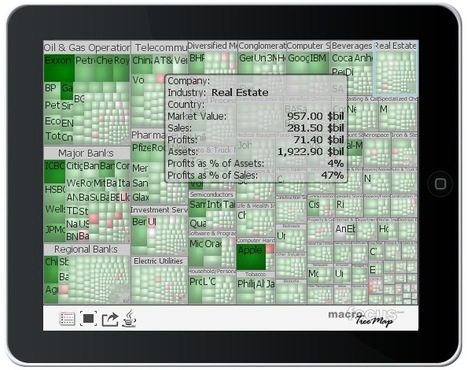
If you are looking for additional visualization tools for displaying data, TreeMap v. 3.0 offers a classic tree map layout as well as others, like squarified variant, circular, tag cloud and voronoi.
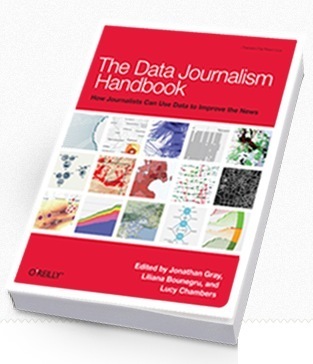
Robin Good: Extracting meaning out of big data, illustrating and visualizing relationships and links between apparently disconnected items and approaching the gathering of information for the purpose of surfacing what otherwise would not be immediately evident, may all be commercially fertile areas as some of the pionerring examples seem to show.
From the original essay, part of the Data Journalism Handbook: "Many journalists seem to be unaware of the size of the revenue that is already generated through data collection, data analytics and visualization.
This is the business of information refinement.
With data tools and technologies it is increasingly possible to shed a light on highly complex issues, be this international finance, debt, demography, education and so on.
...These technologies can now be applied to journalism...
But how does this generate money for journalism?
The big, worldwide market that is currently opening up is all about transformation of publicly available data into something our that we can process: making data visible and making it human.
We want to be able to relate to the big numbers we hear every day in the news — what the millions and billions mean for each of us.
There are a number of very profitable data-driven media companies, who have simply applied this principle earlier than others. They enjoy healthy growth rates and sometimes impressive profits.
a) One example: Bloomberg. The company operates about 300,000 terminals and delivers financial data to it’s users. If you are in the money business this is a power tool. ... This core business generates an estimated US $6.3 billion per year, at least this what a piece by the New York Times estimated in 2008. As a result, Bloomberg has been hiring journalists left, right and centre, they bought the venerable but loss-making “Business Week” and so on.
b) Another example is the Canadian media conglomerate today known as Thomson Reuters. They started with one newspaper, bought up a number of well known titles in the UK, and then decided two decades ago to leave the newspaper business. Instead they have grown based on information services, aiming to provide a deeper perspective for clients in a number of industries. If you worry about how to make money with specialized information, the advice would be to just read about the company’s history in Wikipedia. c) And look at the Economist. The magazine has built an excellent, influential brand on its media side. At the same time the “Economist Intelligence Unit” is now more like a consultancy, reporting about relevant trends and forecasts for almost any country in the world. They are employing hundreds of journalists and claim to serve about 1.5 million customers worldwide."
If you are still doubtful that big data, information refinement, news curation and specialized info services are areas where it is going to be tough to create revenues, think again.
Recommended. 9/10
Full essay: http://datajournalismhandbook.org/1.0/en/in_the_newsroom_10.html
Via Robin Good
From
sparkwi

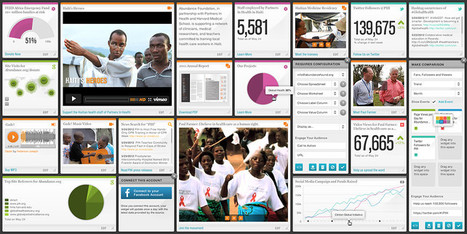
Robin Good: Sparkwise is a new, open-source free web service which allows you to assemble and curate beautiful looking data-dashboards containing the most relevant info and data about a person, a company or an issue. You choose.
How does it work.
You simply connect your social accounts to Sparkwise and then you start to drag and configure the widget buttons representing different data types onto your page. For example you can drag a Twitter Fan Count widget and specify for which Twitter account you want that widget to display the data. There are widgets for just about anything from Twitter, Facebook, YouTube and Google Analytics statistical counters to any data, image or video coming from other sources. You can even type in your own data.
You can create as many dashboard/pages as you like, and publish only the one you want, while keeping control of which widhets and data everyone gets to see.
If you want to create visual engaging story-pages with lots of data to support your focus, this is really a great tool to explore.
Recommended.
Tour: http://sparkwi.se/tour ;
FAQ: http://sparkwi.se/faq ;
Try it out now: http://sparkwi.se/ ; Via Robin Good

's comment June 29, 2012 11:14 AM
at first glance this seems like it could b a great resource for teachers
|


Silk is a web tool to publish online spreadsheet-based data on a specific topic.
The service, which just released a new version of its offering, allows to easily convert any existing data-set into professional-looking data displays, charts, grids, and lists that can be embedded on any site and which can be viewed in multiple ways.
The value of Silk is specifically in making it easy and immediate for anyone to elegantly display and publish data sets in one of several alternative formats which include:
How it works: Import a table from Excel, Google Sheets or any .csv file, select the fields you want to import and Silk does the rest offering you tools to filter, edit and select your preferred visualization approach.
You can also create data sets and displays from scratch inside Silk, and set each Silk either as public or private.
Why it is relevant for content curators: Silk provides a unique and powerful opportunity to leverage existing data and information assets, spreadsheets and databases and to convert them into highly legible and visually impactful data displays on a very specific topic.
My evaluation: Paired with the power of Kimonolabs or Import.io to convert any website or page content into a spreadsheet, it offers great potential in creating value by providing multiple professional formats to display, present and interact with such data.
Great tool for curating data-based information assets.
Free forever for public Silks of up to 3000 pages.
Try it out now: https://www.silk.co/
Video tutorials: https://www.silk.co/product
Silk is a web tool to publish online spreadsheet-based data on a specific topic.
The service, which just released a new version of its offering, allows to easily convert any existing data-set into professional-looking data displays, charts, grids, and lists that can be embedded on any site and which can be viewed in multiple ways.
The value of Silk is specifically in making it easy and immediate for anyone to elegantly display and publish data sets in one of several alternative formats which include:
Table ListGrid MosaicGroupsBarsMapDonutLinePieScatterStacksHow it works: Import a table from Excel, Google Sheets or any .csv file, select the fields you want to import and Silk does the rest offering you tools to filter, edit and select your preferred visualization approach.
You can also create data sets and displays from scratch inside Silk, and set each Silk either as public or private.
Why it is relevant for content curators: Silk provides a unique and powerful opportunity to leverage existing data and information assets, spreadsheets and databases and to convert them into highly legible and visually impactful data displays on a very specific topic.
My evaluation: Paired with the power of Kimonolabs or Import.io to convert any website or page content into a spreadsheet, it offers great potential in creating value by providing multiple professional formats to display, present and interact with such data.
Great tool for curating data-based information assets.
Free forever for public Silks of up to 3000 pages.
Try it out now: https://www.silk.co/ ;
Video tutorials: https://www.silk.co/product ;