Latest Social Media News
112.8K views | +0 today
Follow
Latest Social Media News
Curated by Gerrit Bes
Your new post is loading...
Rescooped by Gerrit Bes from Public Relations & Social Marketing Insight
Scoop.it!

​Infographics 101 - How to Create a Viral Infographic ​

​Infographics 101 - How to Create a Viral Infographic ​ | Latest Social Media News | Scoop.it

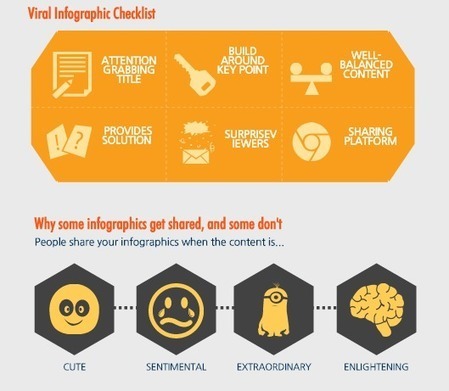
Sharing your infographic online is no different. There are hundreds of thousand of infographics out there. In fact, if you search the term “infographics” in Google over 43 million search results populate. Everything from the latest blog post about infographics (like this one) to different tools and programs you can use to create an infographic appear in search results.So, how do you get your infographic to not only show up, but be shared across networks? Follow the below five steps, do even more research than necessary, and begin your road to virality....


Via Jeff Domansky
Marco Favero's curator insight, April 22, 2015 11:51 AM

aggiungi la tua intuizione ...

Nedko Aldev's curator insight, April 23, 2015 4:45 AM


559
Rescooped by Gerrit Bes from Social Media and its influence
Scoop.it!

The Must-Have Guide To Twitter Manners [Infographic]

The Must-Have Guide To Twitter Manners [Infographic] | Latest Social Media News | Scoop.it
In an effort to keep your Twitter manners properly set up and to make sure you know which part of Twitter is useful for a particular type of question or conversation, check out this visual guide.

Via Gust MEES
Rescooped by Gerrit Bes from Multi Media
Scoop.it!

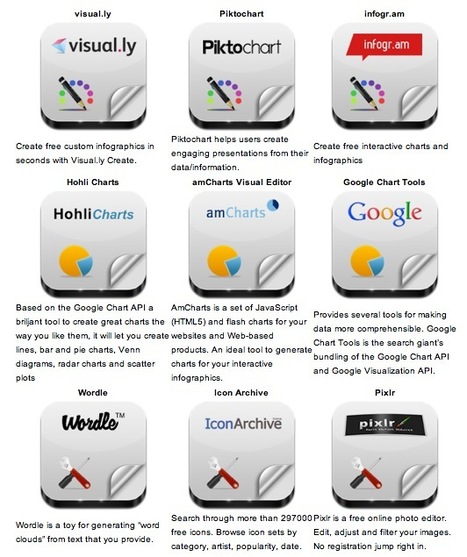
Infographic Builders: 9 Free Tools To Create Great Visual Charts

Infographic Builders: 9 Free Tools To Create Great Visual Charts | Latest Social Media News | Scoop.it

Robin Good: Here is a handy short guide to nine free infographic creation tools that can be utilized to create enticing visuals, word charts and data-based infographics without having special technical skills.


Useful. 8/10


Check them all out: http://www.infographicsarchive.com/create-infographics-and-data-visualization/ ;


(Unearted by Andres Taborga)


Hey All -- sometimes in business we need to display/convey data with our storytelling. So how do you display data in engaging ways? I love this article because it shares 6 free tools to use, plus there's a little tutorial on how to make infographics.


We all know how important it is to have the right tool for the job at hand. Bookmark this article so when you need the tools you have them. Enjoy playing with your numbers and showing them in different ways!


Thank you Robin Good for curating this article.


Via Robin Good, J Lynn Lock
Trude Burnett's curator insight, May 9, 2014 3:48 PM

Good tools to make Infographics

becool's curator insight, May 4, 2015 6:40 AM

Infographics voor zij die er nog steeds zot van zijn.

Sahana Chattopadhyay's curator insight, May 4, 2015 11:59 PM

Infographics are great tools to present curated and focused content from a specific perspective. 

Rescooped by Gerrit Bes from Curation Revolution
Scoop.it!

Top 10 Curation Revolution Scoops Of All Time

Top 10 Curation Revolution Scoops Of All Time | Latest Social Media News | Scoop.it

Top 10 Scoops By Clicks

1. http://sco.lt/8Q8W6j Future of Markeing [Infographic] 


2. http://sco.lt/68zYfp 21 Content Types We Crave


3. http://sco.lt/91MkRF SEO, LinkedIn & The Real You, How LinkedIn Is Crowdsoucing You

4. http://sco.lt/7A3OAT New SEO vs. Old SEO Smackdown [Infographic]

5. http://sco.lt/8PV9Np How and Why Google Killed Long Tail of Search [Infographic]


6. http://sco.lt/8Jcwq1 12 Scoop.it Experts Share Top Cureation Tips

7. http://sco.lt/6UD0W9 Why Content Gets Shared: Social Mentions Study

8. http://sco.lt/6a2WVF  The Content Marketing Mix [Infographic]


9. http://sco.lt/88TIZd Six Ways To Expand Your Social Media Reach [Infographic]


10.  http://sco.lt/8eorNx Storytelling Is The New SEO [Slideshare]

 Wow, 5 Infographics contributing 52% of top 10 clicks, a study and a Slideshare. Will do views next and compare and contrast. 


Via Martin (Marty) Smith
malek's curator insight, October 26, 2013 8:08 AM

Another proof what we call 'time' isn't chronological but spatial, the leap change in short period.

Rescooped by Gerrit Bes from 21st Century Learning and Teaching
Scoop.it!

The 4 Brain Essential Learning Steps [Infographic]

The 4 Brain Essential Learning Steps [Infographic] | Latest Social Media News | Scoop.it
Let's look at Brain Essential Learning Steps. In other words, how does the brain process information in the learning process

Via Gust MEES
Gust MEES's curator insight, September 29, 2013 6:32 AM


Learn more:


http://www.scoop.it/t/21st-century-learning-and-teaching?tag=Infographic


Trevor Galbraith's curator insight, September 29, 2013 11:42 PM

Simple reminder to what we in the classroom are on about

Rescooped by Gerrit Bes from MarketingHits
Scoop.it!

35 Social Media Infographics

35 Social Media Infographics | Latest Social Media News | Scoop.it

Whether you own a large online business or a small booming startup, we’re sure you are actively using social media to give your brand the right dose of exposure and get the message across to your targeted audience.

This is a great list of useful cheatsheets for people who want to benefit more from social media marketing.


These 35 cheatsheets cover tips for Facebook, Twitter, Google+ and Pinterest, so you can better understand how to market via social media and how to design pages and content for optimum exposure.


Via Lauren Moss, Brian Yanish - MarketingHits.com
Mark Palmer's curator insight, July 18, 2013 8:47 AM

A really good collection of social media infographics.

Kika Lensvelt's curator insight, July 19, 2013 7:35 AM

cheatsheets Facebook,  Twitter, Google+ & Pinterest

Stephen Dale's curator insight, July 20, 2013 8:20 AM

Heavily biased towards brands and marketing, but some useful data nevertheless. Personally, I'd like to see more examples of how social media is being used for personal development, collaboration and knowledge sharing.

Rescooped by Gerrit Bes from Design, Science and Technology
Scoop.it!

12 Essential Infographics About Apps, Mobile, SEO and Social Media

12 Essential Infographics About Apps, Mobile, SEO and Social Media | Latest Social Media News | Scoop.it

Infographics are changing the way we share information, so we thought it would be a good idea to gather 12 essential ones that would help marketers and businesses understand what’s currently taking place in the online world as well as make better use of the tools we have at our disposal.


Via Lauren Moss, Antonios Bouris
fralec's comment, April 28, 2013 6:55 AM
thank's Lauren !
Rescooped by Gerrit Bes from Social Media (network, technology, blog, community, virtual reality, etc...)
Scoop.it!

Survey Reveals Which Demographics Use What Social Media [INFOGRAPHIC]

Survey Reveals Which Demographics Use What Social Media [INFOGRAPHIC] | Latest Social Media News | Scoop.it

A massive survey of internet users reveals trends in social media usage across numerous platforms, ages, races, genders, population density and which social media sites do they frequently visit. 


The Pew Research Center has released the results of a comprehensive social media survey, conducted over several years to evaluate which demographics were using social media, and on which platforms. Which social networking sites emerged on top?


Of the online adults surveyed at the end of 2012:

67% use Facebook

20% use LinkedIn

16% use Twitter

15% use Pinterest

13% use Instagram

6% use Tumblr


A decent amount of Americans appear to be using social media, but which demographics use social media in greater numbers?


It appears that women use social media 9% more than men do, at a whopping rate of 71%. Other frontrunners with the highest social network activity in their demographic include city dwellers(70%), Hispanics (72%) and adults with a household income below $30,000 annually (72%).


The most pervasive and consistent divider amongst social media users remains, unsurprisingly, their age. 83% of the young adult demographic (18-29 year olds) use social media, which is well over double the activity of online adults over 65 years old (32%).


Via Gust MEES, roberto toppi
Gust MEES's curator insight, May 12, 2013 11:36 AM


Learn more:


http://www.scoop.it/t/21st-century-learning-and-teaching


Gust MEES's curator insight, May 12, 2013 11:40 AM


Learn more:


http://www.scoop.it/t/21st-century-learning-and-teaching


http://www.scoop.it/t/social-media-and-its-influence


Deb Nystrom, REVELN's curator insight, May 17, 2013 4:35 PM

Always good to see the current demographics in social.  Facebook continues to be the king, with women, city dwellers, Hispanics and below $30K on the list, via Pew Research.    Hmmm....   ~  D

Rescooped by Gerrit Bes from Social Media | Apps, Tools and more...
Scoop.it!

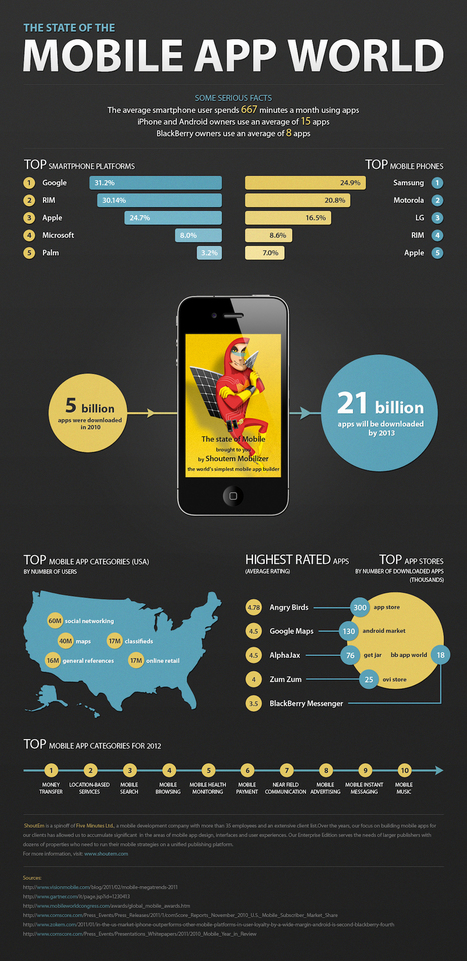
All About Apps (Infographic)

All About Apps (Infographic) | Latest Social Media News | Scoop.it
  via Mobile Future Mobile Future’s infographic showcases the rapid emergence of this relatively new segment of the mobile marketplace and its contributions to U.S. innovation, job creation an...

Via Ana Cristina Pratas, Gust MEES, donhornsby, John van den Brink, Tomas Jansma | FlexMind
Gust MEES's comment, April 24, 2013 3:43 PM
#Tomas, right, BUT in two different TOPICS of my curation ;) Some people are following ONLY 1 TOPIC, so a need 2 bring it in where it fits in ===> #Education and ALSO #Apps, OK?
Tina Laramie's curator insight, April 24, 2013 8:16 PM

This is something to think about. Maybe App developer is in your future.

AlGonzalezinfo's curator insight, April 24, 2013 9:20 PM

$46 Billion by 2016, wow!

Rescooped by Gerrit Bes from Apple, Mac, MacOS, iOS4, iPad, iPhone and (in)security...
Scoop.it!

Why Cyber Security is Important [Infographic]

Why Cyber Security is Important [Infographic] | Latest Social Media News | Scoop.it
Today's infographic is about the AlienVault Open Threat Exchange or OTX, which is a multinational effort to aggregate, and disseminate the fingerprints and  forensics of the latest cyber attacks. The infographic is full of statistics on malware, hack attacks and such.

Via Gust MEES
Gust MEES's curator insight, April 17, 2013 11:39 AM


Check also other infographics here:


http://www.scoop.it/t/securite-pc-et-internet?tag=Infographic


http://www.scoop.it/t/21st-century-learning-and-teaching?tag=Infographic


Check ALSO:


http://www.scoop.it/t/apple-mac-ios4-ipad-iphone-and-in-security


Paula Correia's curator insight, April 19, 2013 5:15 AM

Porque é que a cibersegurança é importante?

O infográfico mostra estatísticas relacionadas com a falta de segurança no universo cibernético e nas redes de comunicação (malware, ataques de hackers etc.) e chama a atenção para os riscos dos ataques cibernéticos (Propriedade intelectual, privacidade pessoal, etc..)

Zhao KQiang's curator insight, March 27, 2014 6:56 AM

the graph shows the  information about lots of internet connector of the majority countries have the risk of lost information of finance or personal information

Rescooped by Gerrit Bes from 21st Century Learning and Teaching
Scoop.it!

The Difference Between Contemporary And Traditional Learning [Infographic]

The Difference Between Contemporary And Traditional Learning [Infographic] | Latest Social Media News | Scoop.it
Do you know the difference between contemporary and traditional learning and teaching styles? This handy chart breaks it down quite well.

Via Gust MEES
Gust MEES's curator insight, March 24, 2013 4:57 AM


A MUST read for any teaching person!!!


Rescooped by Gerrit Bes from Google + Project
Scoop.it!

20 Reasons Why you Should Use Google Plus [Infographic]

20 Reasons Why you Should Use Google Plus [Infographic] | Latest Social Media News | Scoop.it

Via Gust MEES
AlGonzalezinfo's curator insight, March 10, 2013 9:05 AM

G+ is catching up big time for many reasons.  Among these reasons is the Hangout integration.  


We just facilitated a remote 1.5 day leadership development session with Hangouts and it was fantastic.  


Google is sticking to their strategy and their value is starting to win people over.  I was never a fan and, through valuable features, I am changing my perspective on the suite of offerings.


This is a relevant infographic.

Penelope's comment, March 10, 2013 6:43 PM
Been thinking about G+. Thanks for sharing, Al. ;)
Shanika Journey's curator insight, March 12, 2013 12:49 PM

NICE ONE! Great reference

Rescooped by Gerrit Bes from 21st Century Learning and Teaching
Scoop.it!

[Infographic] Top Scams on Facebook

[Infographic] Top Scams on Facebook | Latest Social Media News | Scoop.it

Via Gust MEES
Gust MEES's curator insight, March 2, 2013 3:45 PM

Check also for more Security Infographics here:


http://www.scoop.it/t/securite-pc-et-internet?tag=Infographic


Gust MEES's curator insight, March 2, 2013 3:46 PM

Check also for more Security Infographics here:


http://www.scoop.it/t/securite-pc-et-internet?tag=Infographic


Randi Thompson's curator insight, March 3, 2013 4:55 PM

Top Facebook scams to be aware of

Rescooped by Gerrit Bes from MobileWeb
Scoop.it!

Mobile Commerce – What People Browse, Buy and Why? [INFOGRAPHIC]

Mobile Commerce – What People Browse, Buy and Why? [INFOGRAPHIC] | Latest Social Media News | Scoop.it

There had been several articles written linking mobile usage to e-commerce and why marketers need to not only optimize their campaigns to look good on mobile but actually put mobile and social at its center. In this article, we will explore more on the psychology as to how people use their mobile phones, what exactly are they browsing (compared to what they already do on the desktop) and what types of products and/or services they purchase through their phones.


Source: http://ijustdid.org/2013/12/why-mobile-commerce/


Via Brian Yanish - MarketingHits.com
Bridgette Yu's curator insight, December 27, 2013 10:58 PM

yeah. yeah. -.-

Kai Bösterling's curator insight, December 29, 2013 7:29 AM

The Mobile Device is the device of Now-Ism. Anywhere. Anytime. Connected.

Denise Gabbard's curator insight, January 6, 2014 1:47 PM

Some interesting stats on mobile here-- people are increasingly using mobile devices for things they once used desktops and laptops for--wonder if they are like me and can see the little screen closeup better? 


Rescooped by Gerrit Bes from 21st Century Tools for Teaching-People and Learners
Scoop.it!

8 free tools for creating infographics

8 free tools for creating infographics | Latest Social Media News | Scoop.it
Don't have hours to spare crafting something beautiful in Photoshop? Sarah James of The Infographic Design Company selects 8 tools that won't cost you a penny...

Via Gust MEES
David Duncan's curator insight, November 29, 2013 11:49 AM

Here are some great aids if you are thinking of creating infographics

Elena Orlova's curator insight, November 30, 2013 9:32 PM

8 инструментов для создания инфографики

Alison Rostetter's curator insight, December 30, 2013 1:25 PM

I've never made one of these before but it looks like it might be fun to try out on a wintry night.

Scooped by Gerrit Bes
Scoop.it!

Wordle lets you create beautiful word clouds

Wordle lets you create beautiful word clouds | Latest Social Media News | Scoop.it
Pretty cool picture, eh? I made it with Wordle. Wordle is a free website that allows you to make your written content shine by turning it into word clouds for presentations, articles, and more. No ...
Elizabeth Thomas's curator insight, October 31, 2013 2:06 PM

I've been a Wordle fan since discovering the free app last year. It's a creative outlet and a great source of social media content. 

Rescooped by Gerrit Bes from 21st Century Learning and Teaching
Scoop.it!

The Complete Visual Guide To Technology For Children [Infographic]

The Complete Visual Guide To Technology For Children [Infographic] | Latest Social Media News | Scoop.it
This handy visual guide explores technology use by young children. How much and what do they use, and is it appropriate?

Via Gust MEES
Gust MEES's curator insight, October 12, 2013 9:59 AM


Learn more:


http://www.scoop.it/t/21st-century-learning-and-teaching?tag=Infographic


AnnC's curator insight, October 13, 2013 7:37 PM

Lots of great information addressing access to and use of technology by children!

Rescooped by Gerrit Bes from Business & Marketing
Scoop.it!

Virtual Private Networks in the US: Where Should You Be Most Concerned About Your Online Privacy? [INFOGRAPHIC]

Virtual Private Networks in the US: Where Should You Be Most Concerned About Your Online Privacy? [INFOGRAPHIC] | Latest Social Media News | Scoop.it
Virtual private networks, or VPNs, allow people to send and receive data over a public network as if they were connected to a private one. VPNs allow people to protect their internet data while using public networks.

Via DashBurst
No comment yet.
Rescooped by Gerrit Bes from People Data, Infographics & Sweet Stats
Scoop.it!

Me as an infographic! Christina's Bio Illustrates It.

Me as an infographic! Christina's Bio Illustrates It. | Latest Social Media News | Scoop.it

To illustrate the previous full video on teaching, learning and doing research via social media in a university setting, here is an Infographic on Christina Costa.


The website also links to her PhD thesis:  

The participatory web in the context of academic research : landscapes of change and conflicts


I just developed an infographic on my experience using easel.ly


It doesn’t look as great as I’d like – need to improve my design skills!! – but this was pretty easy to create.


A great way to illustrate one’s experience.


Via Deb Nystrom, REVELN
Deb Nystrom, REVELN's curator insight, July 15, 2013 11:29 AM

As she says,  "A great way to illustrate one’s experience."  ~  D

Deb Nystrom, REVELN's curator insight, July 15, 2013 11:36 AM

I'd be remiss if I didn't also Scoop this to my Social Media curation stream at the SMLL - social media at the university, with the video lecturers bio illustrated via this infographic tool.  ~  Deb

Rescooped by Gerrit Bes from Content Curation World
Scoop.it!

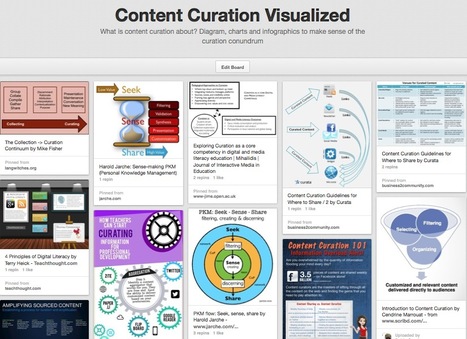
Need To Explain To Others What Content Curation Is? Use This Visual Collection

Need To Explain To Others What Content Curation Is? Use This Visual Collection | Latest Social Media News | Scoop.it
What is content curation about? Diagram, charts and infographics to make sense of the curation conundrum

Via Robin Good
Ali Anani's curator insight, March 4, 2014 12:39 AM

Curate using this visual map

Monica S Mcfeeters's curator insight, March 30, 2014 9:18 AM

This will be helpful to share to those wondering about content curation.

Jeff Domansky's curator insight, September 1, 2014 11:53 PM

Valuable collection of the art of curation from Robin Good.

Rescooped by Gerrit Bes from 21st Century Tools for Teaching-People and Learners
Scoop.it!

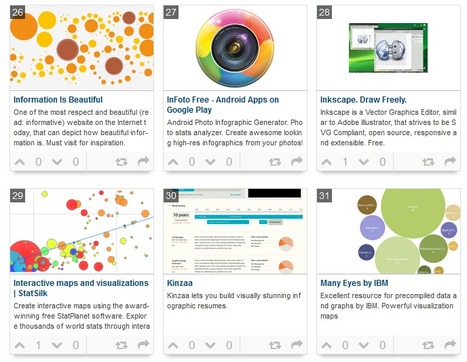
46 Tools To Make Infographics In The Classroom

46 Tools To Make Infographics In The Classroom | Latest Social Media News | Scoop.it

Infographics are interesting–a mash of (hopefully) easily-consumed visuals (so, symbols, shapes, and images) and added relevant character-based data (so, numbers, words, and brief sentences).

The learning application for them is clear, with many academic standards–including the Common Core standards–requiring teachers to use a variety of media forms, charts, and other data for both information reading as well as general fluency...


Via Baiba Svenca, Gust MEES
maite collados's curator insight, January 14, 2014 11:24 AM

Las infografías son una herramienta muy útil por su factor visual: en poco espacio y de forma visulamente agradable y atrayente, engloba datos y relaciona conceptos.

ManufacturingStories's curator insight, July 30, 2014 7:50 AM

For more resources on Social Media & Content Curation visit http://bit.ly/1640Tbl


Cynthia Day's curator insight, July 30, 2014 2:45 PM

apps

Rescooped by Gerrit Bes from Cyberbullying, it's not a game! It's your Life!!!
Scoop.it!

Infographic: The Truth About Mobile, Online Cyberbullying

Infographic: The Truth About Mobile, Online Cyberbullying | Latest Social Media News | Scoop.it
From harassing text messages to demeaning social network comments, teens face a barrage of all-too-common digital bullying tactics in today's world. But is

Via Gust MEES
Rescooped by Gerrit Bes from Social Media and its influence
Scoop.it!

Social Behavior: The Big Game [INFOGRAPHIC]

Social Behavior: The Big Game [INFOGRAPHIC] | Latest Social Media News | Scoop.it
This March Madness-themed infographic uncovers key information on search privacy concerns, social influence, efficacy of images in search results, social sharing behavior, social preferences by social network and demographic, and more.

Via Gust MEES
Gust MEES's curator insight, March 30, 2013 12:58 PM


Check it out, a MUST!!!


Rescooped by Gerrit Bes from "#Google+, +1, Facebook, Twitter, Scoop, Foursquare, Empire Avenue, Klout and more"
Scoop.it!

5 Reasons We Use Social Media [Infographic]

5 Reasons We Use Social Media [Infographic] | Latest Social Media News | Scoop.it
There are many reasons we use social media. From the basic to the more advanced, the tool is simply ubiquitous and addictive. This infographic sheds some light for us all.

Via Gust MEES, ABroaderView
Gust MEES's curator insight, March 17, 2013 10:30 AM


A MUST have infographic...


Latisha Poulard's curator insight, March 21, 2013 10:46 PM

You see why if you don't have an online presence then you are part of a dying breed...

Irma Gallardo's curator insight, April 11, 2013 12:19 PM

¿Qué usamos y cuántos lo usamos?

Rescooped by Gerrit Bes from Design, Science and Technology
Scoop.it!

The Future of Data Visualization Tools

The Future of Data Visualization Tools | Latest Social Media News | Scoop.it

Data is everywhere and well-designed data graphics can be both beautiful and meaningful. As visualizations take center stage in a data-centric world, researchers and developers spend much time understanding and creating better visualizations. But they spend just as much time understanding how tools can help programmers and designers create visualizations faster, more effectively, and more enjoyably.


As any visualization practitioner will tell you, turning a dataset from raw stuff in a file to a final result in a picture is far from a single-track, linear path. Rather, there is a constant iteration of competing designs, tweaking and evaluating at once their pros and cons. The visualization research community has recognized the importance of keeping track of this process.


Read the complete article to learn more about the future of the practice and the tools that enable designers to create thoughtful infographics and visualizations...


Via Lauren Moss, Antonios Bouris
No comment yet.